In our last conversation,(If You Have a Dollar, You’re an Investor. Here’s How to Be a Good One), we established a fundamental truth: from the moment you earn your first dollar, you are an investor. The question isn’t whether to invest, but how. We ended by promising to explore how a beginner should allocate their money and why, historically, some investments have been such powerful engines for building wealth.
Today, we answer those questions with data. A deep analysis of the last three decades of financial history—a period that saw the dot-com bubble burst, a global financial meltdown, and an unprecedented pandemic—paints a clear picture. Let’s move from theory to action and see what the numbers tell us about slicing your financial pie.
The Two Incomes and the Problem with “Safety”
For anyone not born with a silver spoon, wealth begins the old-fashioned way: by trading our time and talent for a paycheck. After our needs are met, the money left over is put to work to grow on its own. This creates two distinct types of income: money you earn before you sleep, and money you earn while you sleep.
- “Before-Sleep” Income is active income. It’s the money you make for the work you do. When you clock out, it stops.
- “While-You-Sleep” Income is passive income. It’s your money working for you, growing and compounding automatically, even when you’re not.
The goal, quite simply, is to shift the balance toward “while-you-sleep” income. This is where investing comes in. However, limited by our financial knowledge, our first encounter with a “while-you-sleep” investment is usually a bank savings account. We think of it as being on the sidelines, but it’s an active choice—an investment in absolute safety.
The problem is that “safety” comes at a steep price. There’s a silent thief at work: inflation. In our modern economy, where currency is backed only by government decree, its value is constantly being diluted. Over the long term, holding cash is one of the few financial moves with a guaranteed loss of real value.
The 30-Year Verdict: A Clear Picture of Performance
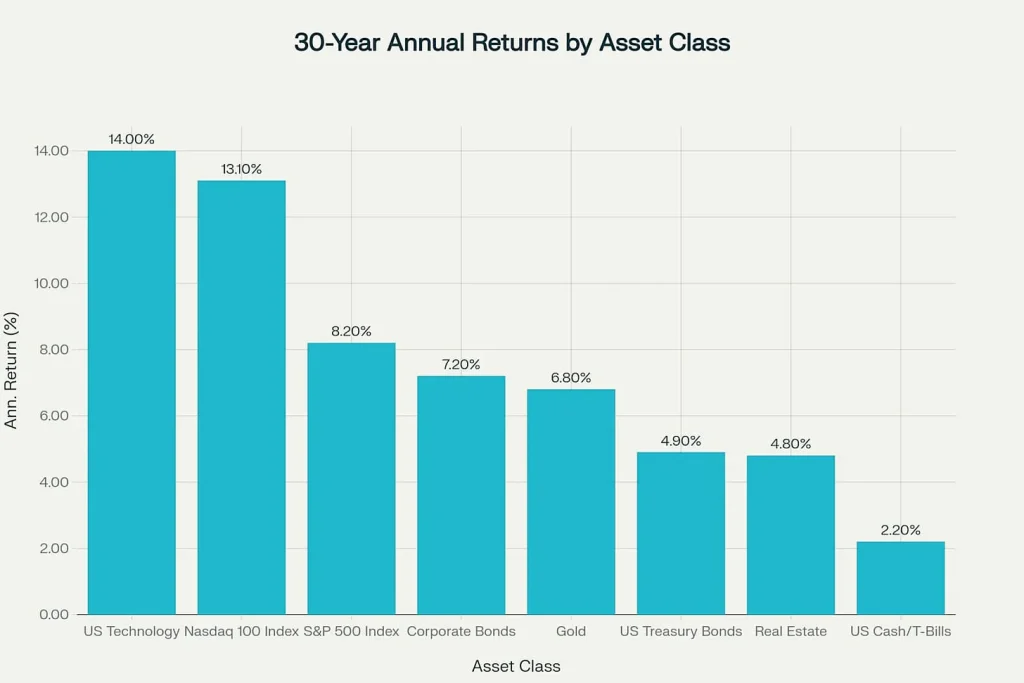
The past 30 years have demonstrated a significant variation in returns across different asset classes, with technology-focused investments leading the pack and cash equivalents lagging far behind. The analysis reveals that equity-based investments have substantially outperformed fixed-income securities and traditional safe-haven assets like gold over this extended period.
30-Year Annual Returns by Asset Class (1995-2025)

Asset Class Performance Rankings
- Top Performers:
- US Technology emerged as the clear winner with an exceptional 14.00% annual return over the 30-year period. This sector benefited from the digital revolution, internet adoption, and the rise of major technology companies that transformed the global economy.
- Nasdaq 100 Index followed closely with a 13.10% annual return, reflecting the strong performance of the largest non-financial companies listed on the Nasdaq stock exchange, many of which are technology-focused.
- S&P 500 Index delivered solid returns at 8.20% annually, representing the broad US stock market performance and demonstrating the long-term wealth creation potential of diversified equity investing.
- Middle-Tier Performers:
- Corporate Bonds provided a 7.20% annual return, offering a balance between growth potential and stability. These securities outperformed government bonds due to their higher yield compensation for credit risk.
- Gold generated a 6.80% annual return, serving its traditional role as an inflation hedge and portfolio diversifier, though it underperformed equity markets during this period of economic expansion.
- Conservative Investments:
- US Treasury Bonds yielded 4.90% annually, providing the security of government backing but with lower returns reflecting their reduced risk profile.
- Real Estate returned 4.80% annually, though this figure may not fully capture the total returns available through publicly traded REITs, which have historically performed better during certain periods.
- US Cash/T-Bills delivered the lowest returns at 2.20% annually, barely keeping pace with inflation and highlighting the opportunity cost of holding excess cash over long periods.
The Silent Thief: Why Inflation-Adjusted Returns Matter
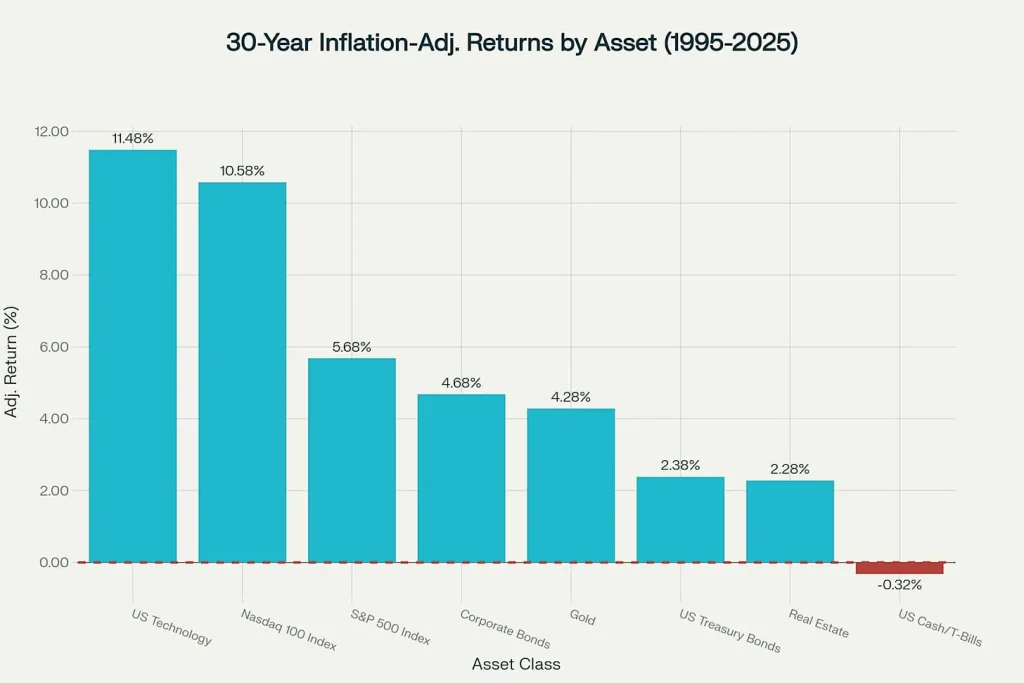
Nominal returns don’t tell the whole story. To understand how much your wealth has actually grown, you have to account for inflation. When we adjust for the average annual inflation of 2.52% from 1995-2025, the performance rankings reveal a crucial insight about purchasing power.
30-Year Inflation-Adjusted Returns by Asset Class (1995-2025)

All asset classes except cash successfully beat inflation over the 30-year period. US Technology maintained its leadership with a real (inflation-adjusted) return of 11.48%. Most critically, cash/T-bills actually lost purchasing power, with a -0.32% real return. This analysis underscores the importance of investing in growth assets to preserve and enhance wealth over time.
The Engine of Growth: The Power of Compounding in Action
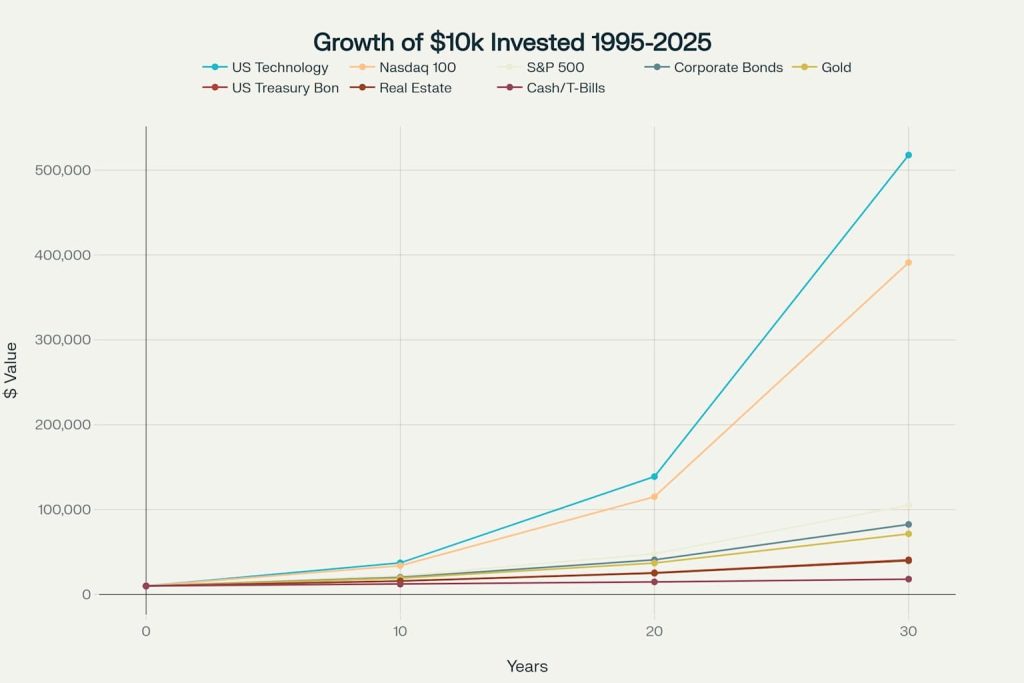
The dramatic impact of these different return rates becomes undeniable when we see how a modest investment would have grown. The chart below shows what would have happened to a single $10,000 investment made in 1995.
Growth of $10,000 Investment Over 30 Years (1995-2025)

An initial $10,000 investment in US Technology would have grown to an impressive $517,730. The same amount in cash would have reached only $18,114. This staggering difference of nearly half a million dollars illustrates why your asset allocation decisions have profound long-term consequences.
Two Paths to Profit: Why Patience Beats Prediction
This data leads to a natural question: If we know stocks go up and down, can’t we just sell before the drops and buy back in at the bottom?
It’s a tempting idea, but history’s greatest investors have a clear answer: no. Even the founder of modern macroeconomics, John Maynard Keynes, famously warned, “Markets can remain irrational longer than you can remain solvent”. His point was that trying to time the market’s cycles is a fool’s errand. Those who try often sell too late, buy back in too late, and get whipsawed by transaction costs and emotional turmoil.
If you’re honest with yourself, you know you can’t predict when the market will soar—if you could, you’d already be on the Forbes list. So why assume you can predict when it will crash? Since you can’t predict the crashes, what is the logic for holding low-return assets like cash while you wait for one?
This reveals two fundamentally different ways to approach stock market returns:
- Profiting from Sentiment (The Dead End): This is the path of market timing—trying to get rich by outsmarting the collective mood of millions of other investors. I have never seen a successful long-term example of this strategy. The road is littered with the bones of those who have tried.
- Profiting from Business Growth (The Viable Path): This is the path of the patient owner. Here, your returns come from the underlying growth of the businesses you own. Over the long run, the U.S. stock market has delivered an average annual return of about 10.4%. If you are content with that return, the path is simple: buy a share of the entire market through a broad index fund and hold on.
The first path requires you to be a fortune-teller. The second only requires you to be a patient business owner. The choice is clear.
The Secret to Success: Sticking With Your Slices
The S&P 500’s journey over this period demonstrates the importance of a long-term perspective. Despite experiencing significant volatility, including major downturns in 2000-2002 and 2008 (-37.00%), the index delivered strong overall returns through the subsequent recovery periods.
This brings us to the final, most important lesson: asset allocation. Historical data suggests that higher equity allocations have generally produced superior long-term returns. For example, a 100% stock portfolio averaged 10.3% annually from 1926-2019, while a traditional 60/40 stock/bond portfolio returned 8.8% annually. However, those higher returns came with increased volatility; the 100% stock portfolio experienced annual losses as high as -43.1%.
The single most important lesson from the past 30 years is that no single asset class is the winner every year. The leadership rotates, often unpredictably. This is precisely why you diversify. You hold different slices because you don’t know what kind of crisis is coming next. A well-sliced pie is designed to weather different storms.
The hardest part is having the discipline to stick with your plan. You don’t “exit the game”; you simply rebalance your pie periodically, trimming the slices that have grown too large and adding to the ones that have shrunk. This disciplined, calm approach is what separates successful long-term investors from those who chase returns and get burned.
Building wealth is a marathon, not a sprint. By understanding the roles of different assets and building a diversified portfolio you can live with, you put the powerful forces of long-term growth and compounding on your side.
Relax to Rich — Calm, Thoughtful Investing

