An Analysis of U.S. Fund Manager Performance: Three Decades of Evolution, Challenge, and Adaptation (1995-2025)
Introduction: The Shifting Sands of Active Management
The Promise of Alpha
The foundational premise of active fund management is the pursuit and delivery of alpha. In the lexicon of modern finance, alpha represents a fund manager’s ability to generate returns that exceed a relevant market benchmark, after accounting for the level of market risk (or beta) undertaken.1 It is the quantifiable measure of a manager’s skill—their capacity to add value through security selection, market timing, and strategic portfolio construction.3 For decades, investors have allocated trillions of dollars to active managers based on this singular promise: that through superior insight, research, and execution, a manager can consistently “beat the market.” The thirty-year period from 1995 to 2025 stands as a crucible in which this promise has been rigorously tested, debated, and, for many, found wanting.
From Star Managers to Structural Scrutiny
The landscape of fund management in the early 1990s was profoundly shaped by the preceding era, a time dominated by the narrative of the “star manager.” Figures like Peter Lynch of the Fidelity Magellan Fund became household names, celebrated for their seemingly uncanny ability to deliver extraordinary returns.5 Lynch’s tenure at Magellan from 1977 to 1990, during which the fund averaged an annual return of over 29% and grew its assets from $18 million to $14 billion, cemented a powerful and highly marketable archetype in the public consciousness: the investment guru whose individual genius could unlock market-beating performance.5 This narrative fueled a period of explosive growth for the mutual fund industry, with assets soaring from under $1 trillion to nearly $7 trillion during the 1990s, driven by strong market performance and unprecedented investor demand.7
However, the very success of this era created a set of investor expectations that would prove largely unsustainable. The market conditions that may have enabled such dramatic individual outperformance—characterized by potentially lower overall market efficiency and less intense professional competition—began to erode. The subsequent three decades represent a fundamental shift in focus. The conversation moved away from the lone genius and toward a more sober, structural scrutiny of the active management industry itself. This new paradigm has been defined by a relentless focus on the corrosive effect of fees, a deeper understanding of market efficiency, and, most critically, the rise of low-cost, systematic passive alternatives that have mounted an existential challenge to the traditional active model.8 The widespread availability of comprehensive data, most notably the S&P Indices Versus Active (SPIVA) scorecards, confronted investors with a stark reality that stood in sharp contrast to the star manager narrative. The data revealed that, in aggregate, the majority of active managers were not only failing to replicate the heroic feats of their predecessors but were consistently underperforming their benchmarks.8 This created a cognitive dissonance for an entire generation of investors, prompting a major re-evaluation of the active management value proposition and fueling a historic capital shift toward passive strategies.
Thesis and Report Roadmap
This report posits that the story of U.S. fund manager performance over the past thirty years is one of diminishing aggregate alpha, a trend driven by a powerful confluence of structural, technological, and regulatory forces. These include increasing market efficiency, the disruptive democratization of information and trading via the internet, regulatory actions that leveled the informational playing field, and relentless downward pressure on fees from passive competitors. While pockets of outperformance persist and individual skill undoubtedly exists, the environment in which managers must operate has become profoundly more challenging, fundamentally altering the calculus for investors seeking to identify and benefit from that skill.
To build this argument, this report will proceed as follows. Section 2 will establish a comprehensive toolkit for performance evaluation, moving beyond simple returns to the critical risk-adjusted and operational metrics that define modern analysis. Section 3 will contextualize this analysis by examining the major market cycles of the last three decades, from the dot-com bubble to the AI-driven frenzy, outlining the distinct challenges and opportunities each period presented. Sections 4 and 5 will form the core of the “Great Debate,” first presenting the definitive empirical evidence from the SPIVA scorecards on the active versus passive battle, and then delving into the seminal academic research on the “skill versus luck” dichotomy. Section 6 will deconstruct the key structural factors that influence outcomes, including investment styles, fees, asset bloat, and manager tenure. Section 7 will explore the evolution of the battlefield itself, detailing how technology, regulation, and the rise of ETFs have reshaped the industry. Section 8 will provide profiles of legendary managers to illustrate key lessons and the evolution of successful strategies. Finally, the report will conclude by synthesizing these findings to offer a nuanced outlook on the future of active management and provide actionable guidance for the sophisticated investor navigating this complex landscape.
The Anatomy of Performance: A Modern Toolkit for Evaluation
Evaluating a fund manager’s performance requires a sophisticated framework that extends far beyond the simple calculation of total returns. A high return figure, in isolation, reveals little about the manager’s skill; it could be the product of excessive risk-taking, a favorable market environment, or pure luck. A modern toolkit for evaluation, therefore, must incorporate a suite of risk-adjusted metrics and qualitative operational factors to provide a holistic and accurate assessment of a manager’s true value-add. The popularization of these metrics has not only empowered investors but has also created a more demanding and transparent environment for fund managers, who are now judged on a multi-variable scorecard where the quality and riskiness of returns are as important as their magnitude.
Beyond Absolute Returns: The Primacy of Risk-Adjusted Metrics
In the early 1990s, access to detailed fund analytics was largely the domain of institutional professionals, with retail investors often relying on simplistic return data and marketing narratives.6 The subsequent democratization of financial information, driven by the internet and platforms like Morningstar, brought sophisticated analytical tools to the masses.10 This has rightly shifted the focus to risk-adjusted metrics, which seek to answer the crucial question: how much return is being generated for each unit of risk taken?
Alpha (α)
Alpha is the quintessential measure of active management skill. It represents the portion of a fund’s return that is not attributable to the general movement of the market.1 A positive alpha indicates that the manager has generated returns above and beyond what would be expected given the fund’s level of systematic risk (beta), signifying successful security selection or market timing.3 Conversely, a negative alpha suggests the manager has underperformed the benchmark on a risk-adjusted basis, and that investors would have been better off in a passive fund after accounting for fees.1 Alpha is typically calculated using the Capital Asset Pricing Model (CAPM) framework, as shown in the formula for Jensen’s Alpha 13:
Alpha=R−(Rf+β(Rm−Rf))
Where:
● R = The portfolio’s return
● Rf = The risk-free rate of return
● β = The portfolio’s beta
● Rm = The market benchmark’s return
For investors, alpha is the ultimate litmus test: it isolates the value a manager adds (or subtracts) from the investment process.1
Beta (β)
Beta measures a portfolio’s sensitivity or volatility relative to the overall market, which is assigned a beta of 1.1 A fund with a beta greater than 1 is expected to be more volatile than the market; for instance, a beta of 1.2 suggests the fund’s price will move 20% more than the market in either direction.4 A beta less than 1 indicates lower volatility.3 Understanding a fund’s beta is critical for assessing its risk profile. A high-beta fund might be suitable for an investor seeking aggressive growth, while a low-beta fund would appeal to a more risk-averse investor.1 Beta is a crucial input in the calculation of alpha, as it determines the expected return against which the manager’s actual return is measured.2
Sharpe Ratio
Developed by Nobel laureate William F. Sharpe, the Sharpe Ratio is one of the most widely used measures of risk-adjusted return.15 It quantifies the amount of excess return (above the risk-free rate) an investor receives for each unit of total risk, as measured by standard deviation (volatility).1 The formula is:
SharpeRatio=(Rp−Rf)/σp
Where:
● Rp = The portfolio’s return
● Rf = The risk-free rate of return
● σp = The standard deviation of the portfolio’s excess return
A higher Sharpe Ratio is always better, as it indicates a more favorable risk-return trade-off. Generally, a ratio greater than 1 is considered good, while a ratio above 2 is considered excellent.14 For example, a fund with a 12% return, a standard deviation of 8%, and a risk-free rate of 3% would have a Sharpe Ratio of
(12, meaning it earns 1.125 units of return for each unit of risk taken.15 This metric allows for direct comparison between funds with different strategies and levels of volatility.16
Sortino and Treynor Ratios
Two key variations on the Sharpe Ratio provide additional nuance. The Sortino Ratio is similar to the Sharpe Ratio but modifies the denominator to consider only downside deviation, or “bad” volatility.1 This is particularly useful for investors who are more concerned with protecting against losses than with the volatility of gains.1 The
Treynor Ratio, in contrast, uses beta (systematic risk) as its denominator instead of total risk (standard deviation). This ratio aims to determine whether an investor is being adequately compensated for taking on risk that cannot be diversified away.13
Information Ratio
The Information Ratio measures a manager’s ability to generate excess returns relative to a benchmark, but it adjusts these returns for the consistency or volatility of that outperformance.4 It is calculated by dividing the fund’s alpha by its tracking error (the standard deviation of its excess returns). A higher Information Ratio indicates a manager who not only beats the benchmark but does so with a greater degree of consistency, which is a powerful indicator of skill.12
Qualitative and Operational Factors
Beyond these quantitative metrics, a thorough evaluation must also consider several operational factors that directly impact investor outcomes and provide insight into a manager’s strategy and discipline.
Expense Ratio
The expense ratio represents the annual percentage of a fund’s assets used to cover operating costs, including management fees, administrative expenses, and marketing (12b-1 fees).12 This fee directly and inexorably erodes an investor’s returns. While a ratio of 0.50% or 1.00% may seem small, the compounding effect over decades can be immense, potentially consuming tens or even hundreds of thousands of dollars from a long-term portfolio.18 Unlike market performance, which is unpredictable, the expense ratio is a known quantity and one of the most reliable predictors of a fund’s future performance relative to its peers.18
Portfolio Turnover Rate
This metric indicates how frequently a manager buys and sells securities within the fund, expressed as an annual percentage.3 A high turnover rate (e.g., 50% or more) suggests an active trading strategy, which can incur significant transaction costs (brokerage commissions, bid-ask spreads) that are not included in the expense ratio but are borne by the fund and its investors.3 High turnover can also lead to greater tax inefficiency, as frequent selling can realize short-term capital gains, which are typically taxed at higher rates. A low turnover rate (e.g., below 20%) is indicative of a more patient, buy-and-hold strategy, which tends to be more cost-effective and tax-efficient.20
Manager Tenure
Manager tenure is the length of time the current manager has been running the fund.21 A long and successful tenure, ideally spanning five to ten years or more, provides a stronger basis for evaluating a manager’s skill, as it demonstrates their ability to navigate various market cycles.3 When a fund has a strong long-term record but a new manager, an investor cannot be confident that past performance will continue. High turnover in the management team can disrupt strategy and diminish performance.3 Therefore, ensuring that the manager responsible for a fund’s track record is still at the helm is a critical due diligence step.22
Assets Under Management (AUM)
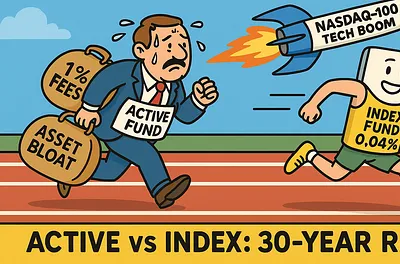
AUM represents the total market value of the investments a fund manager oversees.12 Rapidly growing AUM can be a sign of investor confidence and a successful track record. Furthermore, larger funds can benefit from economies of scale, which may lead to lower expense ratios.20 However, excessive AUM can lead to a phenomenon known as “asset bloat,” where a fund becomes too large to be managed effectively according to its original strategy. This can force a manager to deviate from their best ideas and can become a significant drag on performance, a topic that will be explored in greater detail in Section 6.23
Active Share
Active Share measures the percentage of a fund’s portfolio that differs from its benchmark index.12 A high active share (e.g., 80% or more) indicates that the manager is making significant bets away from the index, reflecting a truly active strategy. A low active share (e.g., below 60%) suggests the fund is a “closet indexer”—a manager who largely hugs the benchmark while still charging high active management fees. For investors paying for active management, a high active share is a prerequisite, as it demonstrates the manager is at least attempting to generate alpha through differentiated security selection.12
The Market’s Crucible: Major Economic Cycles and Their Impact (1995-2025)
The performance of a fund manager cannot be assessed in a vacuum. It is inextricably linked to the prevailing market environment. The thirty-year period from 1995 to 2025 was not a monolithic bull market but a tumultuous journey marked by distinct economic cycles, speculative bubbles, devastating crashes, and paradigm-shifting technological and monetary policies. Each phase presented a unique set of challenges and opportunities, rewarding certain investment styles while punishing others. Understanding this historical context is essential for interpreting manager performance and distinguishing genuine skill from simply being in the right place at the right time. The increasing concentration of market leadership in recent cycles, for instance, has created a structural headwind that has made outperformance fundamentally more difficult for diversified active managers, a reality that directly informs the performance data presented in subsequent sections.
Overview of Market Performance
As a baseline for evaluation, the U.S. stock market delivered robust long-term returns over the past three decades. From the start of 1994 through the end of 2024, the S&P 500 index generated an average annualized return of approximately 9%, or 6.3% after adjusting for inflation.25 Other sources place the nominal return closer to 10%.26 This strong overall performance, however, masks periods of extreme volatility. The journey included the single worst year for the S&P 500 since the Great Depression (2008) and a period of five consecutive years with returns exceeding 20% (1995-1999).27 The major U.S. indices—the S&P 500, the Dow Jones Industrial Average (DJIA), and the NASDAQ Composite—each followed a path shaped by these powerful economic and technological forces.
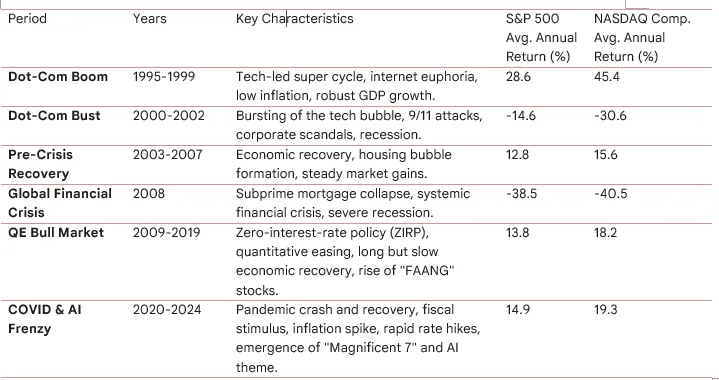
The following table provides a high-level summary of the major market cycles and the corresponding performance of key U.S. benchmarks. This serves as a critical reference for contextualizing manager performance throughout this report.
Note: Average annual returns are calculated from year-end closing values for the specified periods using data from sources 27 and.29 These are nominal price returns and do not include dividends.
The Dot-Com Boom and Bust (1995-2002)
The Boom (1995-1999)
The second half of the 1990s was a phenomenal period for U.S. equities, defined by a confluence of powerful forces: robust GDP growth of 3-5%, moderate inflation, and, most notably, a world-changing technology super cycle.28 The widespread adoption of the personal computer, driven by the “WinTel” alliance of Microsoft and Intel, and the dawn of the commercial internet unleashed a massive wave of investment and speculation.28 This period of “irrational exuberance” propelled markets to unprecedented heights.31 The S&P 500 delivered five consecutive years of returns greater than 20%, a feat unmatched in the index’s history.27 The tech-heavy NASDAQ Composite was the epicenter of the mania, soaring 400% from 1995 to its peak in March 2000, reaching a staggering price-to-earnings ratio of 200.29 This environment was a golden age for growth-oriented fund managers, particularly those with heavy exposure to the technology and telecommunications sectors. Managers who embraced the “new economy” narrative were richly rewarded, while more cautious, value-oriented managers significantly lagged.
The Bust (2000-2002)
The speculative bubble burst spectacularly in March 2000. The subsequent unwind was brutal and protracted, exacerbated by the 9/11 terrorist attacks in 2001 and a series of corporate accounting scandals. The S&P 500 recorded three straight years of losses: -10.1% in 2000, -13.0% in 2001, and -23.4% in 2002.27 The NASDAQ Composite was decimated, falling by -39.3% in 2000, -21.1% in 2001, and -31.5% in 2002.29 This period served as a stark test of managers’ risk-management discipline. It was a rare environment where active managers, as a group, had a distinct advantage. Those who had remained disciplined and underweight in the frothy, overvalued technology sector were able to protect capital far better than the market-cap-weighted indices that were heavily skewed toward these stocks. In 2000, for example, the average active large-blend manager lost only -1.40%, dramatically outperforming the S&P 500’s -9.43% decline, largely because they held a lower average weight in the technology sector.32
The Pre-Crisis Recovery and the Global Financial Crisis (2003-2009)
Recovery (2003-2007)
The market began a steady recovery in 2003, with the S&P 500 surging 26.4% that year.27 This bull market was broader than the tech-driven mania of the late 90s and was fueled by an expanding economy and a burgeoning housing bubble. From 2003 through 2007, the S&P 500 delivered five consecutive years of positive returns, providing a favorable backdrop for most equity managers.
The Global Financial Crisis (GFC) (2008)
The collapse of the U.S. subprime mortgage market in 2007 triggered a systemic financial crisis that plunged the global economy into its deepest recession since the 1930s. In 2008, the financial system seized up, leading to a catastrophic market crash. The S&P 500 plummeted by -38.5%, its worst annual performance in the entire 30-year period.27 The DJIA suffered a similar fate, with its deepest drawdown since the Great Depression reaching over -48% from its peak.33 The NASDAQ Composite fell -40.5%.29 This crisis was the ultimate test of active management’s promise to provide downside protection. While some managers successfully navigated the turmoil, many were caught off guard by the systemic nature of the risk, and the period highlighted the difficulty of preserving capital during a true market meltdown.
The Era of Quantitative Easing and Unprecedented Bull Market (2009-2021)
In response to the GFC, the U.S. Federal Reserve and other central banks embarked on an unprecedented experiment in monetary policy, cutting interest rates to near zero and injecting trillions of dollars of liquidity into the financial system through quantitative easing (QE). This decade-plus period of “cheap money” created an exceptionally favorable environment for financial assets and fueled one of the longest bull markets in history.34 The S&P 500 rebounded sharply with a 23.5% gain in 2009 and, with few exceptions, marched steadily higher for the next decade.27
This environment, however, proved to be particularly challenging for active fund managers. The sustained, low-volatility rise of the market meant that beta (market return) was the dominant driver of performance, leaving little room for alpha generation. Furthermore, the ultra-low interest rate environment disproportionately benefited long-duration growth stocks, particularly a handful of mega-cap technology companies (“FAANGs”), while value stocks lagged significantly.34 As these few stocks grew to dominate the market-cap-weighted indices, diversified active managers who were underweight them faced a persistent headwind, contributing to the widespread underperformance documented by the SPIVA reports during this period.
The Post-COVID Era: Inflation, Rate Hikes, and AI Frenzy (2022-Present)
The final phase of this 30-year period began with the COVID-19 pandemic in 2020, which triggered a sharp but brief market crash followed by a stunningly rapid recovery fueled by massive fiscal and monetary stimulus. This stimulus, however, eventually led to the highest inflation in four decades, forcing the Federal Reserve to embark on its most aggressive interest rate hiking cycle since the 1980s. This policy shift ended the era of cheap money and triggered a bear market in 2022, with the S&P 500 falling -19.4%.27
The market then staged another powerful rebound in 2023 and 2024, but this rally was characterized by extreme concentration. A small group of mega-cap technology companies, dubbed the “Magnificent 7,” drove the vast majority of the S&P 500’s gains, fueled by investor euphoria around the promise of artificial intelligence (AI).36 As of year-end 2023, the 10 largest stocks in the S&P 500 accounted for 35% of its total value, a level of concentration exceeding even the peak of the dot-com bubble.37 This created an almost insurmountable challenge for the average diversified active manager. To outperform, a manager would have needed to take on a highly concentrated, and arguably imprudent, position in these few names. Being underweight these stocks, as most diversified managers were, created a performance drag that was nearly impossible to overcome, regardless of the skill demonstrated in their other holdings. This dynamic starkly illustrates how the very structure of the market can dictate performance outcomes, independent of manager skill.
The Great Debate I – Active vs. Passive: The Unflattering Verdict of SPIVA
For the past two decades, the most comprehensive and widely cited arbiter in the debate between active and passive management has been the S&P Indices Versus Active (SPIVA) scorecard. Published semi-annually by S&P Dow Jones Indices, these reports provide a rigorous and objective analysis of how actively managed funds in the U.S. and around the world have performed against their appropriate benchmarks.8 The consistent and unambiguous findings from this extensive body of research have been instrumental in shaping investor perceptions and have provided the empirical backbone for the massive shift of capital from active to passive strategies. The data reveals a powerful, self-reinforcing cycle: as the evidence of active underperformance becomes more widely known, capital flows into passive funds, which can, in turn, make the market more benchmark-driven and thus even harder for the remaining active managers to outperform.
Introducing SPIVA
The credibility of the SPIVA scorecards stems from a robust methodology designed to eliminate common biases found in other performance studies. Its key strengths include 8:
1. Survivorship Bias Correction: Many performance reports only include funds that exist for the entire measurement period, ignoring those that were merged or liquidated, which are typically the worst performers. SPIVA corrects for this by including these “dead” funds in its initial universe, providing a more honest and complete picture of the entire opportunity set.8
2. Asset-Weighted Returns: In addition to equal-weighted figures, SPIVA calculates asset-weighted returns. This provides insight into how the average invested dollar performed, giving more influence to larger funds, which is more representative of the aggregate investor experience.38
3. Apples-to-Apples Comparisons: Funds are compared against benchmarks appropriate for their investment style (e.g., large-cap growth, small-cap value), avoiding the misleading practice of comparing all funds to a single broad-market index like the S&P 500.8
4. Net-of-Fees Returns: The analysis uses fund returns after deducting management fees and other operating expenses, reflecting the actual net return an investor would receive.38
The Long-Term Underperformance Story
The headline finding from over 20 years of SPIVA reports is unequivocal: over meaningful long-term horizons, the vast majority of active fund managers fail to outperform their designated benchmarks.8 While short-term results can fluctuate, the tendency for active funds to underperform grows stronger as the observation period lengthens.
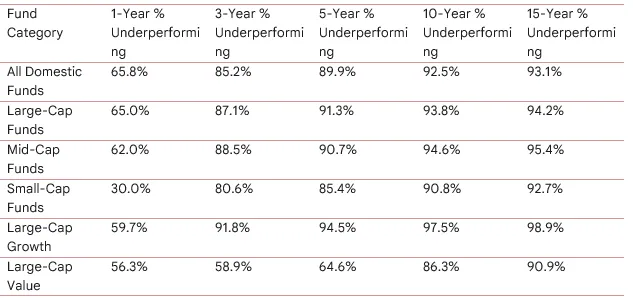
The following table, summarizing data from the year-end 2024 SPIVA U.S. Scorecard, illustrates this stark reality across major equity categories.
SPIVA U.S. Scorecard Summary: Percentage of Active Funds Underperforming Benchmarks (Year-End 2024)
Source: Synthesized from data points across multiple SPIVA reports, primarily 40 and.41 Note that underperformance percentages typically increase with the time horizon.
The data is damning. Over a 15-year period ending in December 2024, more than 93% of all U.S. domestic equity funds failed to beat their benchmarks.41 In the large-cap growth category, a staggering 98.9% of managers underperformed over 15 years, meaning an investor had a roughly 1 in 100 chance of picking a winning fund that survived and outperformed over that period.40 The conclusion from this data is clear: the promise of alpha, for the active management industry as a whole, has not been met.
The Persistence Problem: Skill or Luck?
Even when a fund does manage to outperform, the critical question for an investor is whether that performance is due to repeatable skill or transient luck. The SPIVA Persistence Scorecards address this by tracking the consistency of top-performing funds over time. If outperformance were a result of skill, one would expect top managers to remain at the top. The evidence, however, shows the opposite.9
The core finding of the Persistence Scorecards is that outperformance is overwhelmingly ephemeral.43 A fund manager who lands in the top quartile of their peer group in one period has a very low probability of repeating that performance in subsequent periods—a probability often no better, and sometimes worse, than random chance.42
● Data Point: The year-end 2022 U.S. Persistence Scorecard delivered a particularly stark result: of all the large-cap funds that were in the top quartile in 2020, zero managed to remain in the top quartile for the next two consecutive years.9 The random expectation for this would be 6.25% (25% x 25%).
● Data Point: Looking at a slightly lower bar, only 5% of large-cap funds that were above the median in 2020 stayed above the median for the next two years. The random expectation would be 25% (50% x 50%).9
This dramatic lack of persistence provides powerful evidence that most short-term outperformance is a product of luck rather than skill.9 An investor who chases a hot fund based on a one- or three-year track record is likely to be disappointed, as that luck runs out and performance reverts to the mean. Interestingly, the scorecards do find evidence of persistence at the
bottom of the performance distribution; poor performers have a higher-than-random chance of remaining poor performers or being liquidated.44
Where Active Has a Better Chance
Despite the bleak overall picture, the SPIVA data does not suggest that active management is universally futile. It highlights specific market segments where managers have historically had a greater chance of success, typically in areas believed to be less efficient.
● Small-Cap Equities: The theory holds that smaller companies are less covered by Wall Street analysts, creating more opportunities for diligent managers to uncover mispriced securities. The SPIVA data often supports this. The year-end 2024 report was a banner year for this thesis, with an exceptional 70% of active small-cap managers outperforming the S&P SmallCap 600 Index.41 While this was an outlier year, small-cap funds consistently show higher rates of outperformance over shorter periods compared to their large-cap counterparts.
● Fixed Income: The bond market, with its complexity and sensitivity to macroeconomic factors, can also be a fertile ground for active management. The 2024 SPIVA report showed that in a dynamic interest rate environment, a majority of active managers in several fixed income categories, particularly broad investment-grade and municipal bonds, were able to outperform their benchmarks.41 Their flexibility to adjust duration and credit exposure proved valuable.
● Market Corrections: As noted in Section 3, active managers possess the flexibility to adopt defensive postures during market downturns by raising cash or shifting to less volatile sectors. Historically, this has allowed them to outperform passive, fully-invested indices during corrections.32 In 22 of the last 28 market corrections over 35 years, active management has outperformed passive benchmarks.32
These exceptions, however, do not invalidate the broader conclusion. They simply suggest that the probability of success for active management is not uniform across all market environments and asset classes.
The Great Debate II – Skill vs. Luck: Insights from Academia
While the SPIVA scorecards provide the empirical “what”—that most active managers underperform—the academic world has sought to explain the “why.” For decades, financial economists have rigorously investigated the fundamental question of whether the outperformance observed in some funds is a product of genuine, repeatable skill or simply the inevitable result of random chance in a market with thousands of participants. This line of inquiry culminates in a powerful theoretical argument: that active management is a zero-sum game before costs and, therefore, a negative-sum game after costs. This intellectual framework, most famously advanced by Nobel laureate Eugene Fama and his collaborator Kenneth French, provides the profound logic that underpins the entire passive investing revolution.
The Fama and French Bombshell
In their seminal 2010 paper, “Luck versus Skill in the Cross-Section of Mutual Fund Returns,” Fama and French moved beyond simply counting how many funds beat the market. They sought to determine if the entire distribution of fund performance was consistent with a world where managers had skill, or a world where outcomes were driven purely by luck.46
The Core Question and Methodology
The central challenge in assessing manager performance is that with thousands of funds, some will outperform and some will underperform purely by chance, just as some people will flip ten heads in a row in a coin-tossing contest.49 The question is whether the number of “winners” and “losers” is greater than what random chance would predict.47
To solve this, Fama and French developed an innovative bootstrapping simulation.50 Their methodology can be understood as follows:
1. Calculate Actual Alphas: They first ran regressions for thousands of U.S. equity mutual funds from 1984 to 2006 to estimate each fund’s historical alpha (a measure of risk-adjusted performance, or “skill”).52
2. Create a “Luck-Only” Universe: They then created a parallel, simulated universe of funds. In this “cloned population,” they mathematically set the true alpha for every single fund to zero. This means, by construction, that no manager in this simulated world possessed any skill.50
3. Simulate Returns: They then simulated thousands of return histories for this luck-only universe, using the same risk characteristics (beta, etc.) and random return volatility as the actual funds. Any “outperformance” (positive alpha) observed in this simulated world was, by definition, purely the result of good luck.47
4. Compare Distributions: Finally, they compared the distribution of alpha estimates from the real world to the distribution of alpha estimates from the luck-only world.52 If real-world managers possessed skill, the distribution of their alphas should be “fatter” in the tails—meaning more big winners (and perhaps more big losers) than could be explained by luck alone.53
The Findings
The results of the Fama and French study were a watershed moment for the active management industry. They found that the distribution of alphas from the actual funds was remarkably similar to the distribution from the luck-only simulation.52
● No Evidence of Skill for the Majority: For the vast majority of funds, the performance was statistically indistinguishable from what would be expected from a manager with zero skill.47 The results suggested that most funds do not have enough skill to produce returns that cover their costs.47
● More Unskilled than Skilled Managers: The distribution of real-world fund alphas actually had a fatter negative tail than the luck distribution. This implied that after accounting for fees, there were more managers with statistically significant negative skill than managers with statistically significant positive skill.47
● The Top Performers: Even at the very top of the performance distribution, the evidence for skill was weak. The outperformance of the top 2-3% of funds was only slightly better than what would be expected from the luckiest funds in the simulated universe.47 Fama and French concluded that even if this top sliver contained some genuinely skilled managers, it was impossible for an investor to distinguish them from the merely lucky ones, as their performance was not high enough to be statistically certain it wasn’t just chance.47
The Paradox of Skill
The findings of Fama and French and the SPIVA scorecards do not necessarily mean that fund managers are unintelligent or lazy. In fact, the opposite is likely true. The difficulty in outperforming can be explained by the “paradox of skill,” a concept that describes how, as the average skill level in a competitive field rises, luck becomes a more dominant factor in determining outcomes.54
In the 1960s, the investment world was populated by a mix of professionals and less-sophisticated amateurs. A skilled manager had a significant edge. Today, the market is dominated by highly intelligent, well-resourced professionals (MBAs, CFAs, PhDs) all using similar analytical tools and accessing the same information instantaneously.54 Because the competition is so fierce and the general level of skill is so high, the
relative advantage of any single manager is diminished. Their collective efforts to find mispriced securities have the effect of making the market more efficient, arbitraging away the very opportunities they seek to exploit. In this environment, the difference between a great manager and a good manager is small, and that small difference can easily be overwhelmed by the randomness of market movements—by luck.54
Implications for Investors
The collective weight of this academic evidence provides a powerful theoretical foundation for the empirical results seen in the SPIVA data. The logic, first articulated by William Sharpe, is simple but profound 46:
1. In aggregate, all investors own the entire market. Therefore, the average return of all investors before costs must equal the market’s return.
2. This can be divided into two groups: passive investors and active investors. Before costs, the average return of the passive group equals the market return, which means the average return of the active group must also equal the market return.
3. However, active management is, by its nature, significantly more expensive than passive management due to higher fees, research costs, and trading expenses.46
4. Therefore, as a matter of simple arithmetic, the average active investor after costs must underperform the average passive investor after costs.
Fama and French’s work adds a crucial layer to this argument, showing that the distribution of returns around this average is driven more by luck than by a wide dispersion of skill. If true, persistent skill is exceedingly rare and nearly impossible for an investor to identify beforehand, then the strategy of trying to pick winning managers based on past performance is fundamentally flawed and likely to fail.42 This leads to the logical conclusion that investors should focus not on the futile search for alpha, but on the factors they can actually control, the most significant of which are diversification and, above all, costs.
Structural Headwinds and Tailwinds: Factors Shaping Manager Performance
Beyond the grand debates of active versus passive and skill versus luck, a fund manager’s performance is profoundly influenced by a set of structural and strategic factors. These elements—including the prevailing investment style, the burden of fees, the size of the fund, and the manager’s own tenure—create powerful headwinds and tailwinds that can dictate outcomes independent of a manager’s underlying skill. A particularly potent and often self-defeating cycle exists where strong performance attracts massive asset flows, leading to “asset bloat,” which in turn compromises the original strategy and leads to underperformance. Understanding these dynamics is crucial for any sophisticated investor seeking to look beyond headline returns and assess the true, sustainable drivers of a fund’s performance.
The Cyclical Dance of Value vs. Growth
One of the most significant factors determining a manager’s relative performance in any given period is their investment style, most commonly categorized as either “value” or “growth.”
● Value Investing: This approach, pioneered by Benjamin Graham, involves buying stocks that appear to be trading for less than their intrinsic or book value.55 Value stocks are often found in more mature, cyclical industries and are characterized by low price-to-earnings (P/E) or price-to-book (P/B) ratios and sometimes higher dividend yields.57
● Growth Investing: This strategy focuses on companies with the potential for above-average future earnings growth, even if their current valuations appear high.57 Growth stocks are typically found in innovative sectors like technology and biotechnology and are prized for their potential for significant capital appreciation.57
History shows that leadership between these two styles is not constant but rotates in long, pronounced cycles.34 For example, the period following the dot-com bust in the early 2000s was highly favorable for value stocks, as investors fled speculative tech names for companies with tangible assets and stable earnings.58 Conversely, the decade following the Global Financial Crisis (c. 2009-2021) was one of the most dominant periods for growth stocks in history. The environment of ultra-low interest rates made future earnings more valuable in present-day terms, disproportionately benefiting technology and other growth-oriented companies.34
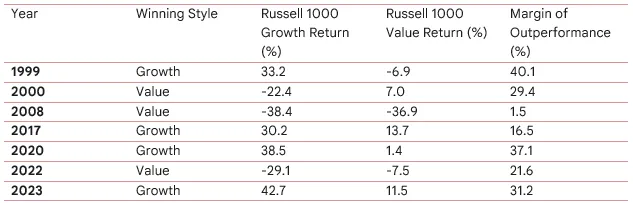
This cyclicality has profound implications for manager evaluation. A value manager may have appeared unskilled during the growth-dominated years of the late 2010s, only to look like a genius during the value resurgence of 2022.56 The following table illustrates the annual see-saw between the two styles, highlighting how a manager’s performance can be heavily influenced by the prevailing market “wind” at their back.
Value vs. Growth Annual Outperformance (Select Years)
Source: Data synthesized from multiple sources including 56 and historical market data. Returns are approximate total returns for illustrative purposes.
The Unrelenting Drag of Fees and Expenses
As established in previous sections, fees are the most reliable and persistent drag on investor returns. Every dollar paid in expenses is a dollar that is not compounded over time, and the effect of this erosion becomes monumental over an investment lifetime.18 The total cost to an investor includes not only the widely publicized
expense ratio (which covers management fees, administrative costs, and marketing/distribution 12b-1 fees) but also shareholder fees like front-end or back-end sales loads (commissions) and redemption fees.17
The impact is not trivial. Consider a hypothetical $100,000 investment that earns a 4% annual return over 20 years.
● With a low annual expense of 0.25%, the portfolio grows to approximately $210,000.
● With an expense of 1.00%, the portfolio grows to only $179,000. The seemingly small 0.75% difference in fees consumes nearly $30,000 of the investor’s final portfolio value.19 Because fees are a predictable and controllable factor, they are arguably the single most important metric for investors to consider when selecting a fund, as lower-cost funds have a significant mathematical head start over their higher-cost peers.18
The Challenge of “Asset Bloat”
Ironically, one of the biggest threats to a fund manager’s long-term success is success itself. When a fund performs exceptionally well, it attracts a torrent of new investment, causing its assets under management (AUM) to swell. This phenomenon, known as “asset bloat,” can severely handicap a manager’s ability to continue outperforming.23
The mechanisms through which bloat erodes performance are straightforward:
● Liquidity Constraints: A manager of a multi-billion dollar fund cannot easily invest in small, nimble companies. Their large trades would overwhelm the stock’s normal trading volume, driving up the purchase price and depressing the selling price. This effectively closes off the universe of small-cap stocks, which is often a source of alpha.61
● Forced Diversification: To deploy the massive amount of cash, the manager may be forced to invest in their 50th or 100th best idea, rather than concentrating on their top 20. This “diworsification” dilutes the impact of their best ideas and causes the fund’s performance to more closely resemble the benchmark.62
● Style Drift: A small-cap manager, unable to find enough opportunities in their mandated space, may start buying larger, more liquid mid-cap stocks. This fundamentally changes the fund’s strategy and risk profile, a phenomenon known as “style drift”.23 Investors who bought the fund for its small-cap exposure are now getting something different.
The classic case study is the Fidelity Magellan Fund after Peter Lynch’s departure. Under Lynch, the fund grew to $14 billion, already a formidable size.5 His successors saw the fund’s assets balloon to over $50 billion and then $100 billion, a size at which it became virtually impossible to outperform the market. The fund’s performance subsequently languished for years, in part due to its colossal size.23 Prudent fund companies that prioritize existing shareholders will often “close” a successful fund to new investors to prevent asset bloat from destroying its performance edge.23
The Nuance of Manager Tenure
Conventional wisdom holds that a long manager tenure is a positive attribute. A manager who has been at the helm for a decade or more has proven their ability to navigate multiple market cycles and has a track record that can be reliably assessed.3 An investor buying a fund with a great 10-year record wants to be sure the manager responsible for that record is still in charge.22
However, academic research reveals a more nuanced picture. A 2014 study in the Financial Analysts Journal found that while longer-tenured managers do tend to outperform their less-experienced peers, the key to a long career is often about avoiding significant underperformance rather than achieving spectacular, persistent outperformance.21 Poor performance leads to firings, so longevity itself is a signal of at least baseline competence.
Other studies show that manager changes can have a significant impact. Replacing a poorly performing manager often leads to an improvement in fund returns.63 Conversely, when a “star” manager leaves, their replacement often struggles to match the prior record, leading to performance deterioration.63 Some research even suggests that, all else being equal, investors can expect better risk-adjusted performance from younger managers with MBA degrees who have longer tenures at their specific funds, highlighting a complex interplay of factors.65 Ultimately, while tenure is an important data point, it is not a guarantee of future success and must be considered alongside other factors like fund size, style, and fees.
The Evolving Battlefield: How Technology and Regulation Reshaped the Industry
The last thirty years have witnessed a fundamental and irreversible transformation of the investment management landscape. The twin forces of technological innovation and regulatory reform have systematically dismantled the traditional sources of competitive advantage for active fund managers. Technology democratized information and trading, while regulation leveled the informational playing field. The ultimate culmination of these trends has been the rise of the Exchange-Traded Fund (ETF), a product innovation that has not only capitalized on the documented shortcomings of traditional active management but is now forcing the industry to adapt or risk obsolescence. The modern active manager operates on a battlefield that is vastly more efficient, transparent, and competitive than that of their 1990s predecessors.
The Information Revolution: The Internet and Market Efficiency
In the early 1990s, the flow of financial information was comparatively slow, expensive, and mediated by Wall Street professionals. Active managers could gain an edge through diligent “shoe-leather” research, proprietary access to company management, and superior analytical resources. The advent of the commercial internet shattered this model.10
● Democratization of Information: Suddenly, any investor with a computer had real-time access to a torrent of information that was previously the exclusive domain of professionals: SEC filings via the EDGAR database, earnings reports, news wires, and historical price data became instantly and freely available.10 This drastically reduced the information asymmetry that active managers had long exploited for alpha.
● Impact on Market Efficiency: The implications for market efficiency—the degree to which asset prices reflect all available information—have been profound. Most economists agree that this technological leap has made markets significantly more micro-efficient.31 It has become much harder to find an obviously mispriced stock based on public information because that information is incorporated into prices almost instantaneously by millions of market participants. While some research suggests that the sheer volume of information has created new challenges, and that the quality of corporate disclosures may have even declined in some respects (e.g., the rise of “pro-forma” earnings), the overarching effect has been the erosion of the traditional information-gathering edge.10 One study surprisingly found that markets in the 1930s and 1940s were more efficient in processing earnings news than in the 1980s, suggesting the relationship between information volume and efficiency is not linear. As information complexity grew faster than processing ability, efficiency temporarily declined before improving again with modern technology.67
Leveling the Playing Field: Regulation Fair Disclosure (Reg FD)
If the internet was the technological force that leveled the playing field, Regulation Fair Disclosure (Reg FD) was its regulatory counterpart. Enacted by the SEC in August 2000, Reg FD directly addressed the widespread practice of selective disclosure.68
● The Pre-Reg FD World: Before 2000, it was common practice for companies to provide “guidance” or material, non-public information to a select group of favored Wall Street analysts and large institutional investors before releasing it to the general public.69 This gave those managers a powerful and unfair advantage, allowing them to trade on the information before the rest of the market could react.
● The Mandate of Reg FD: The regulation made this practice illegal. It stipulated that whenever a public company discloses material, non-public information to any market professional (such as an analyst or fund manager), it must make that same information available to the public at the same time (for intentional disclosures) or promptly thereafter (for unintentional disclosures).68
● The Impact on Active Management: Reg FD effectively shut down a primary channel of alpha generation for many active managers. The “edge” was no longer about who you knew or what private conference calls you were on; it was about what you could glean from the same public information available to everyone else.69 This forced a shift from a strategy of information access to one of superior analysis, a fundamentally more difficult game to win consistently. Critics at the time feared Reg FD would have a “chilling effect,” causing companies to disclose less information overall, but the primary result was a more equitable distribution of information.70
The Disruptor: The Rise of Exchange-Traded Funds (ETFs)
The rise of the ETF is arguably the single most disruptive force in asset management over the past thirty years. First introduced in the U.S. in 1993, ETFs remained a niche product for years but have since grown into a dominant, multi-trillion-dollar industry.6 Their growth represents the culmination of the other trends impacting the industry.
● Competition with Mutual Funds: ETFs mounted a direct challenge to the traditional mutual fund structure by offering a superior wrapper with several key advantages 74:
1. Lower Costs: By tracking an index and avoiding the overhead of active management and distribution networks, passive ETFs offered dramatically lower expense ratios.76
2. Tax Efficiency: The unique in-kind creation and redemption mechanism of ETFs allows them to avoid realizing capital gains when accommodating investor flows. This means ETF investors are far less likely to receive the unexpected, taxable capital gains distributions that are common with mutual funds.75
3. Transparency and Tradability: ETFs trade on an exchange throughout the day like a stock, offering intraday liquidity and price discovery, whereas mutual funds are priced only once per day after the market closes.76
● The New Frontier: Active ETFs: Faced with an existential threat from massive outflows from expensive, underperforming active mutual funds into cheap, passive ETFs, the traditional asset management industry has responded by adopting the disruptive technology itself.77 The result has been an explosion in the number and variety of active ETFs. These products seek to combine the potential for alpha generation from active management with the structural benefits (lower costs, tax efficiency, transparency) of the ETF wrapper.74 The growth has been staggering; from just over 100 active ETFs in 2014, the number surged to over 1,600 by 2024.77 Deloitte projects that active ETF AUM in the U.S. will grow from $856 billion in 2024 to an astonishing $11 trillion by 2035, a 13-fold increase.77 This trend represents a direct and formidable challenge to the viability of the traditional active mutual fund, forcing all managers to compete on the more efficient and investor-friendly turf of the ETF.
Profiles in Performance: Lessons from Legendary Managers
While aggregate data provides a powerful narrative about the challenges of active management, the careers of individual legendary managers offer invaluable, nuanced lessons. These profiles illustrate not only what it takes to succeed but also how the very definition of success—and the strategies required to achieve it—has evolved in response to the changing market landscape. The arc from the concentrated, long-only stock-picking “artists” of the 20th century to the diversified, risk-controlled platform “engineers” of today reveals a clear adaptation to a larger, more efficient, and more competitive market where the old ways of generating alpha are no longer sufficient.
The Archetype: Peter Lynch (Fidelity Magellan)
Peter Lynch is the archetypal “star manager” whose name became synonymous with mutual fund success in the 1980s. His track record at the helm of the Fidelity Magellan Fund from May 1977 to May 1990 is the stuff of legend.
● Track Record: Over his 13-year tenure, Lynch delivered an astonishing average annual return of 29.2%, more than doubling the S&P 500’s return over the same period. He outperformed the benchmark in 11 of those 13 years.5 He grew the fund’s assets under management (AUM) from a mere $18 million to a colossal $14 billion.5
● Strategy & Lessons: Lynch’s philosophy was famously distilled into the mantra “invest in what you know.” He was a bottom-up stock picker who believed in exhaustive, on-the-ground research, visiting companies and kicking the tires himself. His approach was flexible and pragmatic; he was willing to invest in growth stocks, value stocks, cyclicals, and turnarounds, owning hundreds and sometimes over a thousand stocks at a time.5
His career offers two critical lessons. First, it represents the zenith of the star manager era, demonstrating that it was once possible for an individual with extraordinary diligence and insight to generate spectacular, persistent alpha. Second, and more critically, it serves as a cautionary tale about the perils of scale. After Lynch’s departure, the Magellan fund continued to grow, eventually exceeding $100 billion in AUM. His successors, despite being talented managers, were unable to replicate his performance. The fund had become too large and unwieldy, a victim of its own success—a prime example of asset bloat crippling a winning strategy.5
The Enduring Icon: Warren Buffett (Berkshire Hathaway)
If Lynch is the archetype of the mutual fund star, Warren Buffett is the enduring icon of long-term value creation, boasting what is widely considered the most impressive investment track record of all time.80
● Track Record: Buffett’s performance is staggering in its longevity and magnitude. From 1965 through 2018, his investment vehicle, Berkshire Hathaway, generated a compound annual return of 20.6%, nearly doubling the S&P 500’s 9.6% annual return over the same period. The total return over this half-century was nearly 2.5 million percent. Even before Berkshire, his private investment partnership from 1957-1968 returned 25.3% annually after fees.80
● Strategy & Lessons: A student of Benjamin Graham, Buffett evolved from a pure “cigar butt” value investor to a proponent of buying wonderful companies at fair prices. His focus is on businesses with durable competitive advantages, or “moats,” which he aims to hold for the long term.55 His career is the ultimate testament to the power of compounding, discipline, and a rational, business-focused approach to investing.
However, Buffett’s record also provides a crucial lesson that he himself frequently acknowledges: size is the enemy of outperformance.80 Berkshire’s most spectacular years of relative outperformance occurred when the company was far smaller. As its market capitalization swelled to over half a trillion dollars, its investment universe shrank to only the largest, most liquid companies in the world, making it mathematically much more difficult to significantly outpace the overall market. His more recent performance, while still strong, has hewed closer to the S&P 500, demonstrating the powerful headwind of asset bloat even for the greatest investor of all time.80
The Modern Hedge Fund Titans: (e.g., Izzy Englander, Ken Griffin)
The modern era of fund management is defined less by singular stock-picking gurus and more by the rise of massive, multi-strategy hedge fund platforms, exemplified by firms like Izzy Englander’s Millennium Management and Ken Griffin’s Citadel.81
● Strategy & Lessons: These firms represent a fundamental evolution in the pursuit of alpha. Instead of relying on the vision of a single manager, they build sophisticated platforms that employ hundreds of independent investment teams, or “pods”.82 Each team operates its own specialized strategy—such as quantitative arbitrage, relative-value equity, or global macro—and is allocated a portion of the firm’s capital.81
The key to their success lies not in a single brilliant investment thesis, but in process and risk management. The central firm provides the infrastructure, technology, and capital, but also enforces brutally strict risk controls. Teams that perform well are allocated more capital; teams that underperform are cut quickly and without sentimentality.81 This model generates alpha by aggregating a large number of uncorrelated, small-scale strategies. It is a direct response to the increasing efficiency of the market; rather than searching for one big mispricing, they systematically harvest hundreds of tiny ones. This evolution from the “artist” (Lynch, Buffett) to the “engineer” (Englander, Griffin) highlights the modern necessity of diversified, process-driven approaches to generate consistent returns in a hyper-competitive environment. However, this evolution has come at a cost for investors, as these platforms often feature higher and more complex fee structures (including “pass-through” expenses) and impose significant liquidity lockups.82
Conclusion and Outlook: The Future of Active Fund Management
Synthesizing Three Decades of Evidence
The preceding analysis of the U.S. fund management industry from 1995 to 2025 paints a clear and compelling picture. The promise of active management—to consistently deliver risk-adjusted returns superior to the market—has been met with a formidable set of challenges that have structurally diminished the aggregate alpha available to investors. The empirical evidence, led by the comprehensive S&P Indices Versus Active (SPIVA) scorecards, demonstrates unequivocally that a significant majority of active managers fail to outperform their benchmarks over long horizons, with any short-term success proving to be largely ephemeral and statistically indistinguishable from luck.
This empirical reality is underpinned by a powerful theoretical framework, most notably the work of Fama and French, which posits that active management is a zero-sum game before costs and a negative-sum game after. This conclusion is not an indictment of the intelligence or diligence of fund managers, but rather a recognition of the “paradox of skill” in a hyper-competitive and increasingly efficient market. The very efforts of skilled managers to exploit inefficiencies have the collective effect of making the market more efficient, thereby arbitraging away their own opportunities.
This dynamic has been accelerated by transformative technological and regulatory shifts. The internet democratized information access, while Regulation FD leveled the informational playing field, eroding the traditional advantages of privileged access that once fueled alpha generation. This evolution created the perfect conditions for the rise of the Exchange-Traded Fund (ETF), a superior investment wrapper that has challenged the traditional mutual fund model with its lower costs, greater tax efficiency, and transparency. The massive and sustained flow of capital from active mutual funds to passive ETFs is not a mere trend, but a rational investor response to decades of accumulated evidence.
The Path Forward for Active Management
Despite this sobering evidence, active management is not obsolete. Its role, however, has fundamentally and permanently changed. The era of closet-indexing—charging high fees for benchmark-hugging portfolios—is over. The future of successful, value-added active management will likely be defined by a clear focus on areas where managers can still offer a demonstrable, justifiable edge. This path forward involves a strategic retreat from the crowded, efficient core of the market and a focus on specialized domains:
1. Niche and Inefficient Markets: The greatest potential for active management lies in less efficient corners of the market where information is scarcer and competition is less intense. These include small-cap equities, emerging and frontier markets, and complex credit or distressed debt strategies where deep, specialized expertise can still uncover significant mispricings.41
2. High Active Share and Conviction: Investors will, and should, refuse to pay active fees for passive-like returns. Successful managers will be those who run truly active, concentrated portfolios built on high-conviction ideas. A high active share will be a non-negotiable prerequisite for justifying an active fee.12
3. Cost Competitiveness: The fee pressure from passive alternatives is relentless and irreversible. Active managers must acknowledge that fees are a primary determinant of net returns for investors. The most viable strategies will be offered at more reasonable price points, increasingly through the more efficient active ETF structure, which combines active potential with lower costs and better tax treatment.77
4. Demonstrable Risk Management: The value proposition of active management must extend beyond just upside capture. A key role for active managers in the future will be to provide downside protection and capital preservation during market downturns, a feat that passive, fully-invested products cannot achieve. Demonstrating an ability to mitigate volatility and navigate corrections will be a critical differentiator.32
Final Recommendations for the Sophisticated Investor
For the sophisticated investor, endowment, or family office, the lessons of the past thirty years provide a clear and actionable framework for evaluating and utilizing active fund managers. The default option for broad market exposure should be low-cost, passive vehicles. The decision to allocate to an active manager should be a deliberate and selective one, justified by a high bar of evidence. When evaluating a manager, investors should:
● Start with Skepticism and a Focus on Costs: Assume that the market is difficult to beat and that fees are the most reliable predictor of long-term relative returns. Any active fee must be justified by a truly unique and compelling value proposition.
● Demand Risk-Adjusted Proof: Look beyond headline returns. Scrutinize the long-term track record using risk-adjusted metrics like Alpha, the Sharpe Ratio, and the Information Ratio to understand the quality and consistency of the returns generated.1
● Verify True Active Management: Insist on a high active share and a clear, consistent, and disciplined investment process. Avoid managers who are closet-indexers or whose strategy is prone to style drift under the pressure of asset bloat.3
● Discount Short-Term Performance: Internalize the lessons from the SPIVA Persistence Scorecards. Be deeply skeptical of stellar one- or three-year track records, as they are more likely to be the product of luck than repeatable skill. Focus on performance over full market cycles.9
● Analyze the Structural Context: Evaluate a manager not in isolation but within the context of their environment. Is their investment style (e.g., value, growth) currently in or out of favor? Is the fund’s AUM approaching a level that could become a headwind to future performance?
● Use Active Management Selectively: View active management not as a core holding for market beta, but as a targeted tool. Employ it to access specific, less efficient market segments or to achieve particular portfolio objectives, such as capital preservation or non-correlated returns, that passive strategies cannot provide.
In conclusion, the active fund management industry has been irrevocably altered. The low-hanging fruit has been picked, and the bar for success is higher than ever. For managers who can adapt by offering specialized skill, demonstrable value, and competitive costs, a viable path forward exists. For investors, the message is equally clear: the age of blind faith in star managers is over, replaced by an era of evidence-based scrutiny where costs are king and alpha must be proven, not just promised.
48. Fama, E. F., & French, K. R. (2010). Luck versus Skill in the Cross-Section of Mutual Fund Returns. The Journal of Finance, 65, 1915-1947. – References – Scientific Research Publishing, accessed June 16, 2025, https://www.scirp.org/reference/referencespapers?referenceid=2523857
50. ARE FUND MANAGERS SKILLED OR IS IT SIMPLY LUCK? A CASE OF ENERGY MUTUAL FUNDS | International Journal of Business & Economics (IJBE), accessed June 16, 2025, https://ielas.org/ijbe/index.php/ijbe/article/view/130
62. Does Fund Size Erode Mutual Fund Performance? The Role of Liquidity and Organization – Columbia University, accessed June 16, 2025, http://www.columbia.edu/~hh2679/AER-SIZE.pdf