

📌 Understanding P/E Ratios: What They Say About the Market (and When They Mislead You)
One of the most widely cited metrics in investing is the Price-to-Earnings ratio—or P/E ratio. It tells you how much investors are willing to pay for $1 of a company’s earnings. But like any tool, it’s only as good as how you use it. Let’s break down what P/E means, how it’s evolved historically, and where we stand today.
🔍 What Is a P/E Ratio?
At its core:
P/E = Stock Price / Earnings per Share (EPS)
A higher P/E usually means the market expects stronger future growth. A lower P/E might suggest pessimism or undervaluation. But context is everything.
🧠 The Three Flavors of P/E
- Trailing P/E
-
- Based on earnings over the past 12 months.
- Most common, but backward-looking.
- Can spike in recessions when earnings collapse (e.g., 2009).
-
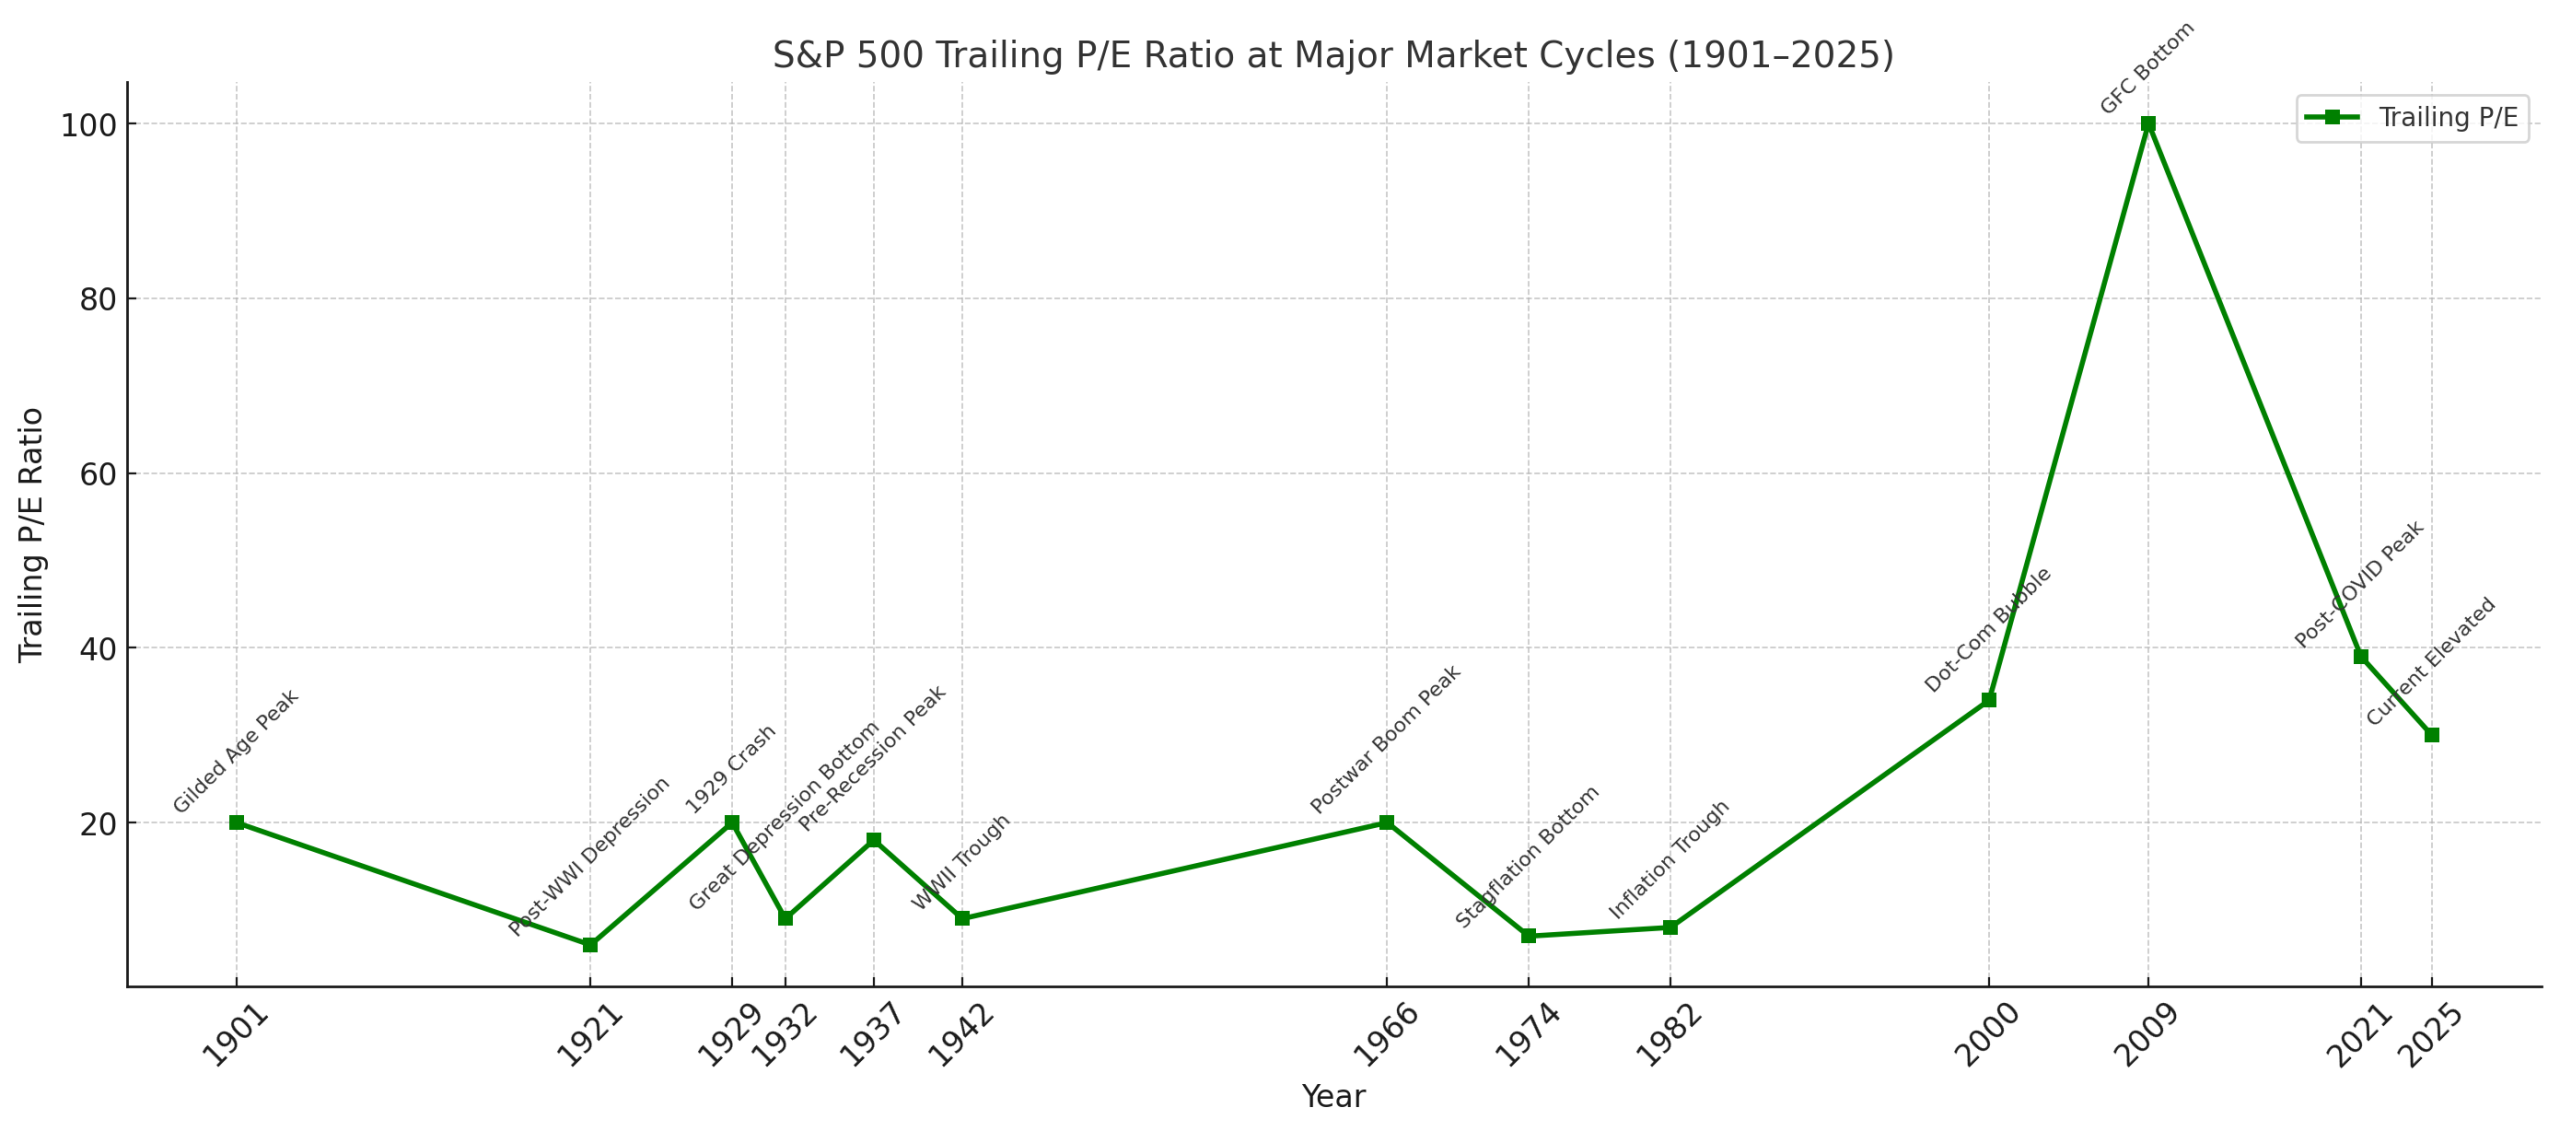
Trailing P/E = price / past 12-month earnings.
It spikes in recessions and bubbles.
-
- Forward P/E
- Based on projected earnings for the next year.
- More reflective of expectations, but relies on analyst forecasts.
-
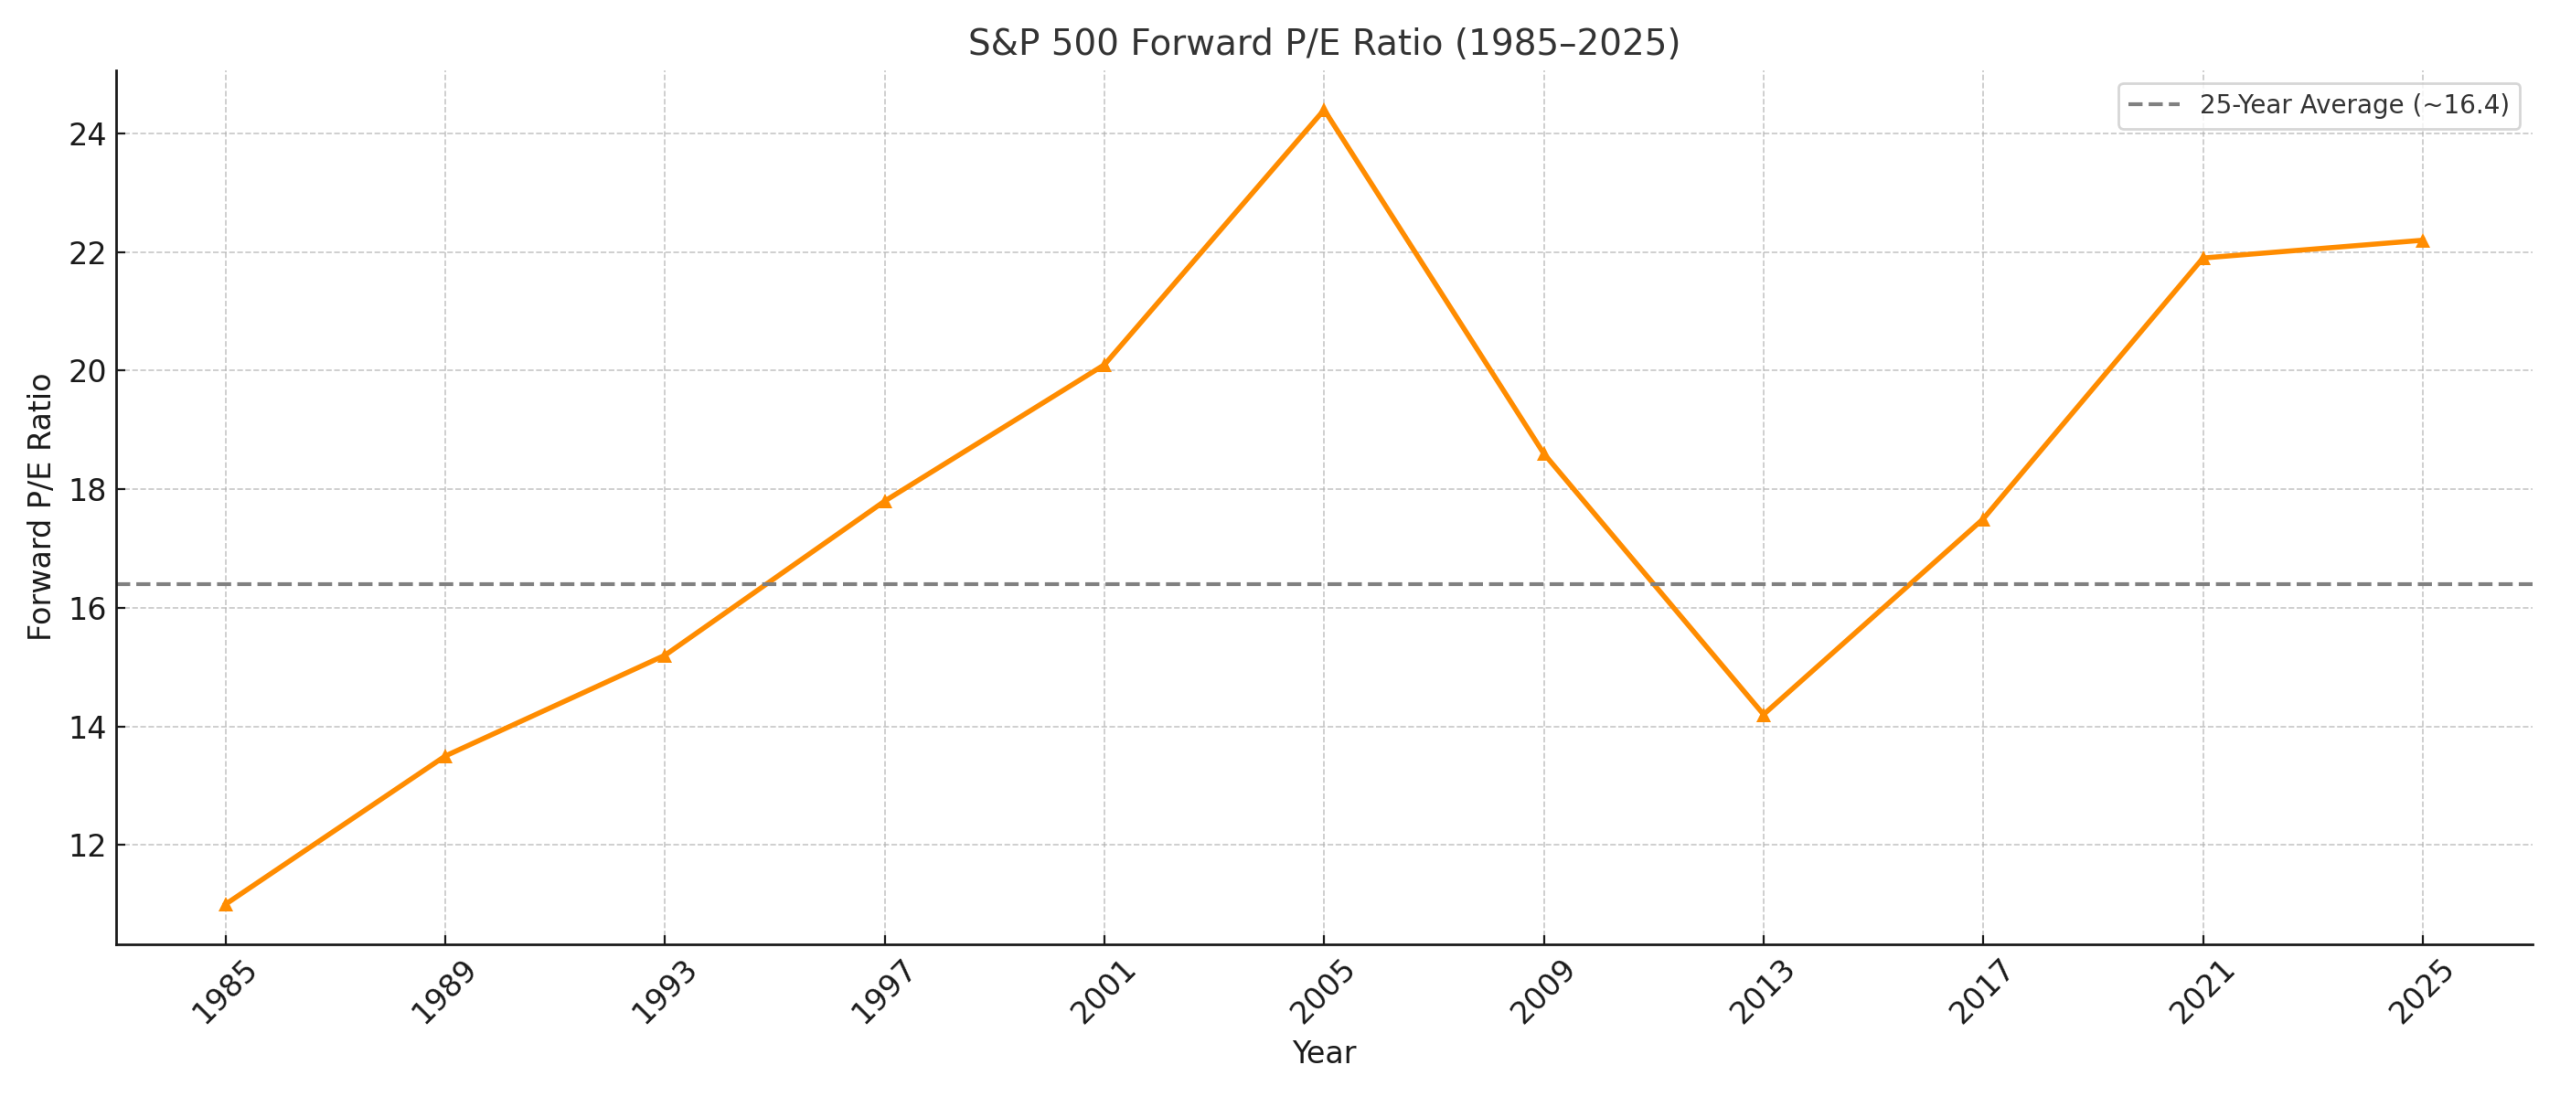
Forward P/E tells us how expensive stocks are based on future earnings.
- Shiller P/E (CAPE)
- Based on 10-year inflation-adjusted earnings.
- Smooths out the noise of business cycles.
- Helps identify long-term overvaluation or bargains.
-
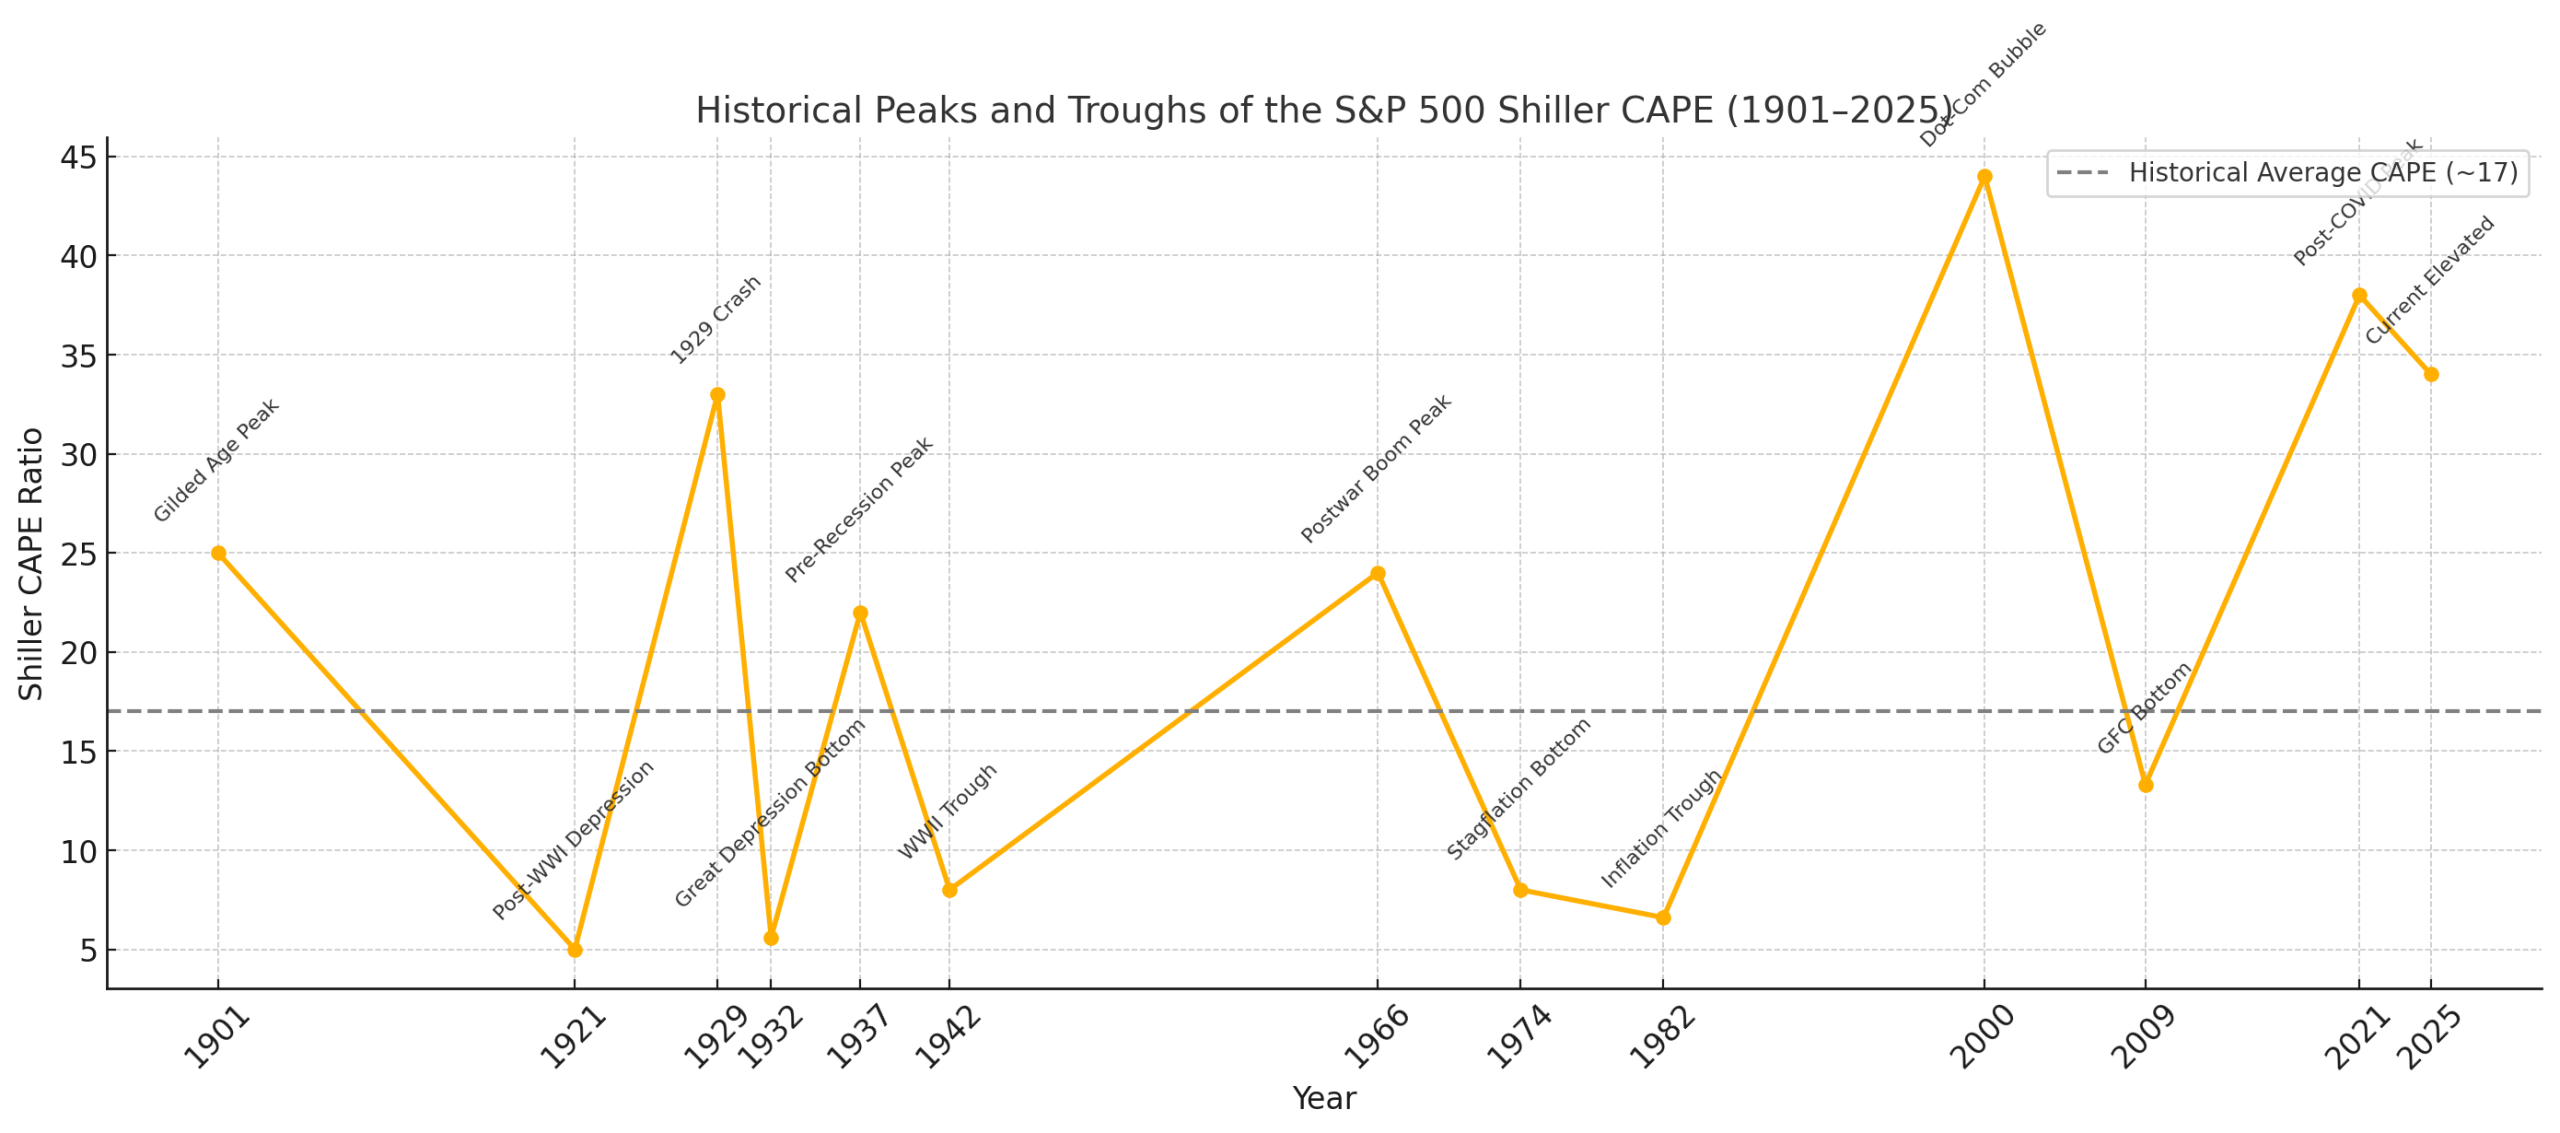
The Shiller CAPE (cyclically adjusted P/E) reveals over 100 years of market psychology.
📈 Historical Lessons from Valuation Extremes
- 1929 (Pre-Great Depression):
Shiller CAPE peaked around 33. Stocks crashed shortly after. - 1982 (End of Stagflation):
CAPE ~6.6, trailing P/E ~7. That was the start of a 20-year bull market. - 2000 (Dot-com Bubble):
Forward P/E hit 24.4, CAPE a record 44.2. Tech collapsed. - 2009 (Financial Crisis):
Trailing P/E > 100 due to earnings collapse. But CAPE suggested a buying opportunity. - 2021–2025 (Recent Cycle):
Forward P/E ~22+, CAPE ~35–38. High optimism priced in.
⚠️ Why Valuation Matters
High P/E = High expectations.
Low P/E = Market skepticism.
But mean reversion is powerful. Historically, buying when P/E ratios are low leads to better long-term returns.
Just ask Warren Buffett:
“The less prudence with which others conduct their affairs, the greater the prudence with which we should conduct our own.”
📊 Where Are We Now?
As of 2025:
- Trailing P/E ~30
- Forward P/E ~22
- Shiller CAPE ~34
All well above long-term averages. That doesn’t mean a crash is coming—but it does suggest future returns may be muted unless earnings grow rapidly.
Final Thought
P/E ratios don’t predict short-term moves. But over time, they help frame risk vs. reward. When the crowd is euphoric, P/Es rise. When fear takes over, they fall.
History shows the best returns often come from buying when it feels the worst—when valuations are low and few want to invest.
Stay calm. Stay disciplined. And always respect the cycle.